-
The order of an algorithm is based on the number of steps that it takes to complete a task. Time is not a valid measuring stick because computers have different processing speeds. We want a method of comparing algorithms that is independent of the computing environment and the speed of the microprocessor.
-
Most algorithms solve problems involving an amount of data, N. The order of algorithms will be expressed as a function of N, the size of the data set.
The following chart summarizes the numerical relationships of common functions of N.
A
N
|
B
O(log2N)
|
C
O(N) |
D
O(N* log2N) |
E
O(N2) |
1
|
0
|
1
|
0
|
1
|
2
|
1
|
2
|
2
|
4
|
4
|
2
|
4
|
8
|
16
|
8
|
3
|
8
|
24
|
64
|
16
|
4
|
16
|
64
|
256
|
32
|
5
|
32
|
160
|
1024
|
64
|
6
|
64
|
384
|
4096
|
128
|
7
|
128
|
896
|
16384
|
256
|
8
|
256
|
2048
|
65536
|
512
|
9
|
512
|
4608
|
262144
|
1024
|
10
|
1024
|
10240
|
1048576
|
|
-
The first column, N, is the number of items in a data set.
-
The other four columns are mathematical functions based on the size of N. In computer science, we write this with a capital O (order) instead of the traditional F (function) of mathematics. This type of notation is the order of an algorithm, or Big O notation.
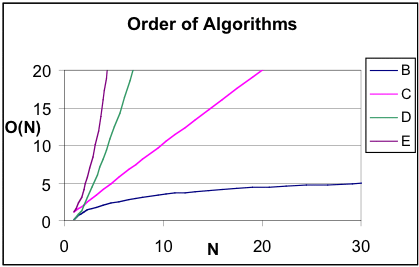
- The graph below, Order of Algorithms, gives a clearer sense of the relationships among the columns of numbers. Since the vertical axis represents the theoretical number of steps required by an algorithm to sort a list of N items, lines B and C represent more efficient algorithms than D and E. Today’s data sets can grow to enormous sizes, so algorithm designers are always searching for ways to reduce the number of steps, even on the fastest supercomputers.

- You have already seen column E in an experimental sense when you counted the number of steps in the quadratic sorting algorithms. The relationship between columns A and E is quadratic - as the value of N increases, the other column increases as a function of N2. The graph of column E is a portion of a parabola.


